Multidimensional Poverty Index: NITI Ayog - UPSC Social Issues
What is Multidimensional Poverty Index: NITI Ayog in UPSC Social Issues?
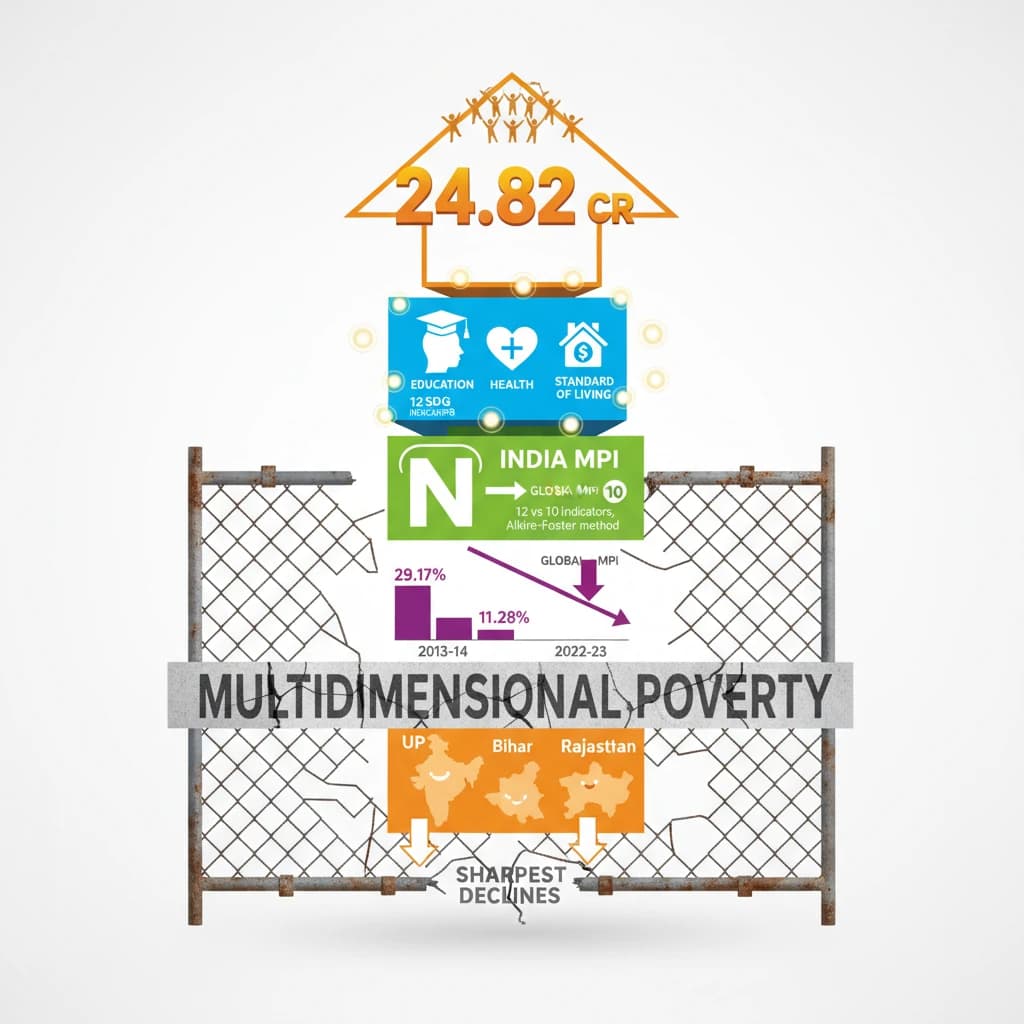
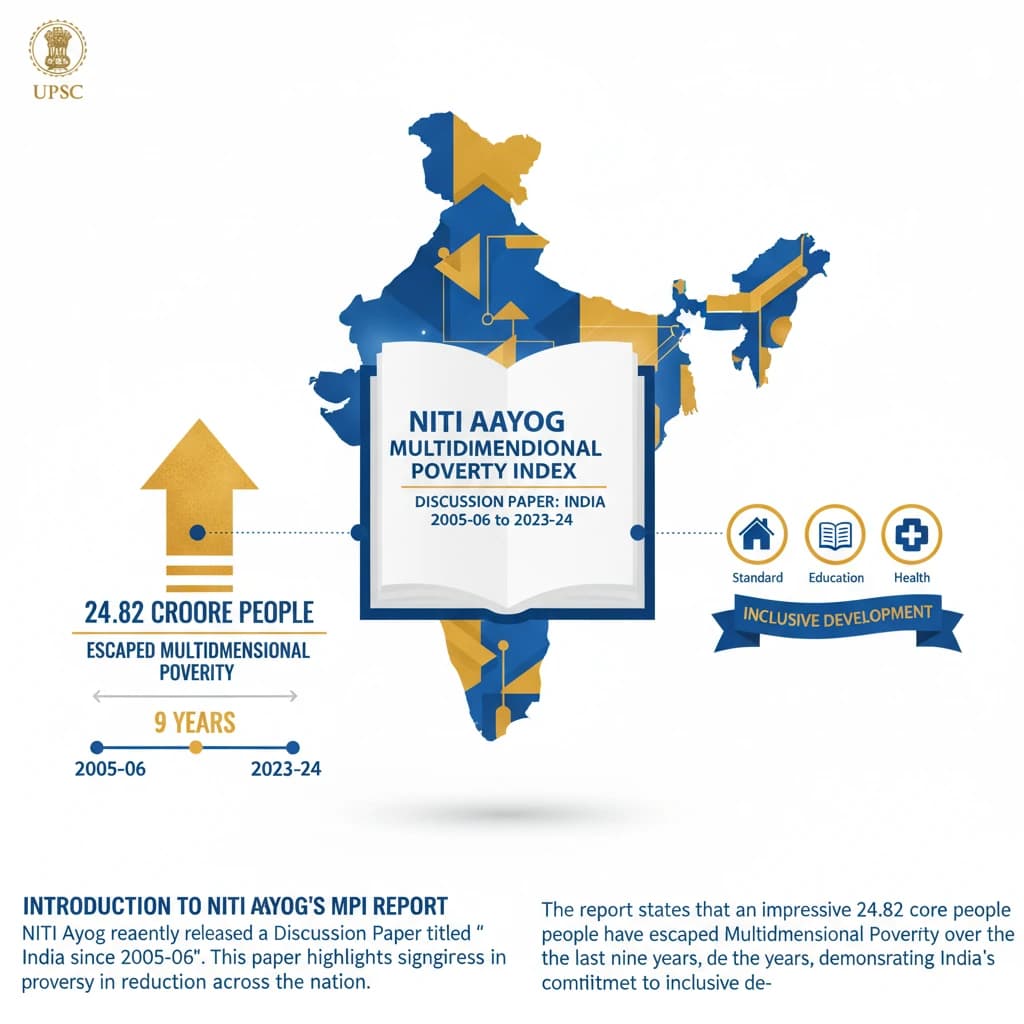
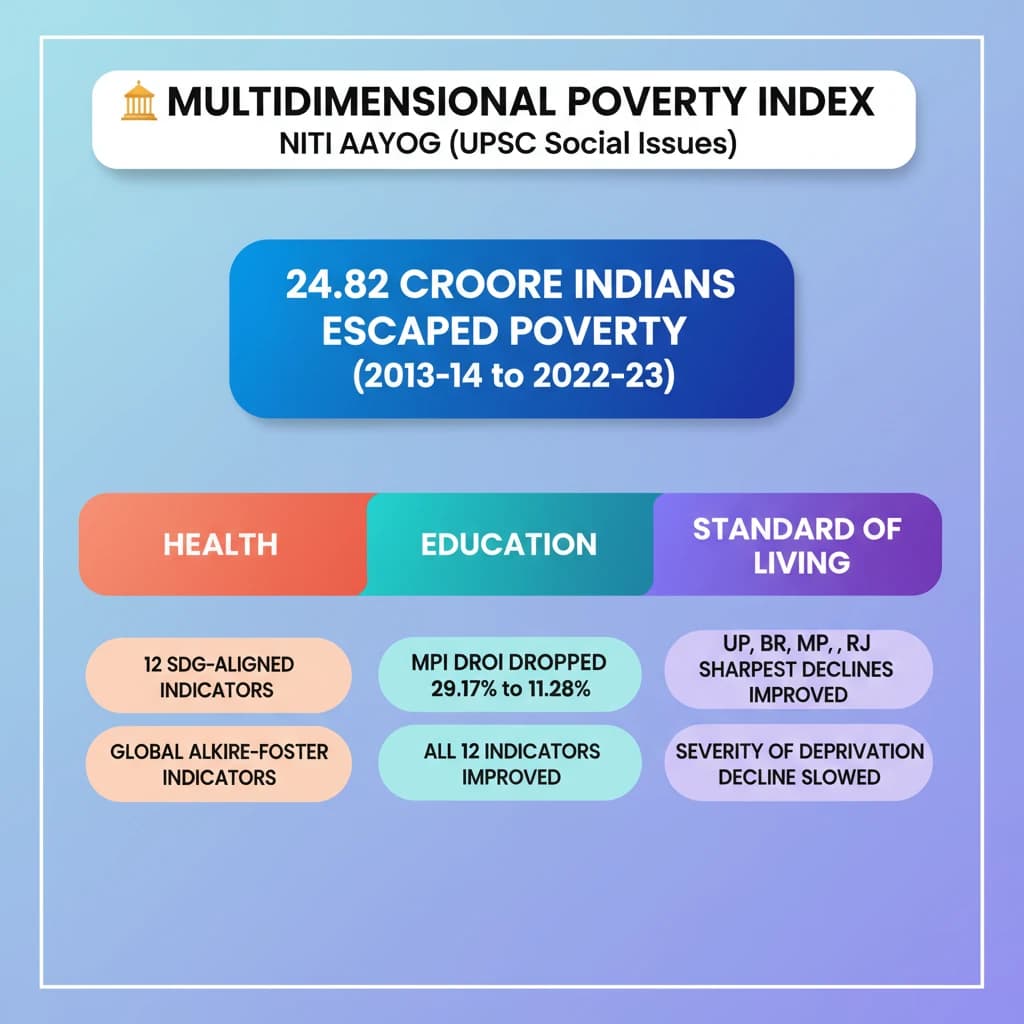
Multidimensional Poverty Index: NITI Ayog is a key topic under Social Issues for UPSC Civil Services Examination. Key points include: NITI Aayog's recent report highlights 24.82 crore people escaped multidimensional poverty in India (2013-14 to 2022-23).. The National MPI measures deprivations across Health, Education, and Standard of Living using 12 SDG-aligned indicators.. India's MPI methodology is based on the global Alkire-Foster method but includes 12 indicators compared to global MPI's 10.. Understanding this topic is essential for both UPSC Prelims and Mains preparation.
Why is Multidimensional Poverty Index: NITI Ayog important for UPSC exam?
Multidimensional Poverty Index: NITI Ayog is a Medium-level topic in UPSC Social Issues. It is tested in both Prelims (factual MCQs) and Mains (analytical answer writing). Previous year UPSC questions have frequently covered aspects of Multidimensional Poverty Index: NITI Ayog, making it essential for comprehensive IAS preparation.
How to prepare Multidimensional Poverty Index: NITI Ayog for UPSC?
To prepare Multidimensional Poverty Index: NITI Ayog for UPSC: (1) Study the comprehensive notes covering all key concepts on Vaidra. (2) Practice previous year questions on this topic. (3) Connect it with current affairs using daily updates. (4) Revise using key takeaways and mind maps available for Social Issues. (5) Write practice answers linking Multidimensional Poverty Index: NITI Ayog to related GS Paper topics.
Key takeaways of Multidimensional Poverty Index: NITI Ayog for UPSC
- NITI Aayog's recent report highlights 24.82 crore people escaped multidimensional poverty in India (2013-14 to 2022-23).
- The National MPI measures deprivations across Health, Education, and Standard of Living using 12 SDG-aligned indicators.
- India's MPI methodology is based on the global Alkire-Foster method but includes 12 indicators compared to global MPI's 10.
- Significant overall decline in MPI from 29.17% (2013-14) to 11.28% (2022-23), with Uttar Pradesh, Bihar, MP, and Rajasthan showing sharpest declines.
- All 12 MPI indicators have shown improvement, but Severity of Deprivation (SoD) decline has slowed in recent years.
- GDP growth alone is insufficient for reducing hunger/improving nutrition; pro-poor policies are crucial.
- Key government initiatives like Poshan Abhiyan, PMGKAY, NFSA, and ICDS are vital in addressing multidimensional poverty.
Multidimensional Poverty Index: NITI Ayog
📖 Introduction
💡 Key Takeaways
- •NITI Aayog's recent report highlights 24.82 crore people escaped multidimensional poverty in India (2013-14 to 2022-23).
- •The National MPI measures deprivations across Health, Education, and Standard of Living using 12 SDG-aligned indicators.
- •India's MPI methodology is based on the global Alkire-Foster method but includes 12 indicators compared to global MPI's 10.
- •Significant overall decline in MPI from 29.17% (2013-14) to 11.28% (2022-23), with Uttar Pradesh, Bihar, MP, and Rajasthan showing sharpest declines.
- •All 12 MPI indicators have shown improvement, but Severity of Deprivation (SoD) decline has slowed in recent years.
- •GDP growth alone is insufficient for reducing hunger/improving nutrition; pro-poor policies are crucial.
- •Key government initiatives like Poshan Abhiyan, PMGKAY, NFSA, and ICDS are vital in addressing multidimensional poverty.
🧠 Memory Techniques