Loading page, please wait…
What are the Key Highlights of the Multidimensional Poverty Index in India Since 2005-2006? - UPSC Social Issues
What is What are the Key Highlights of the Multidimensional Poverty Index in India Since 2005-2006? in UPSC Social Issues?
What are the Key Highlights of the Multidimensional Poverty Index in India Since 2005-2006? is a key topic under Social Issues for UPSC Civil Services Examination. Key points include: India saw a significant 17.89% point reduction in multidimensional poverty from 2013-14 to 2022-23.. Approximately 24.82 crore people escaped multidimensional poverty in the last nine years.. Uttar Pradesh, Bihar, Madhya Pradesh, and Rajasthan recorded the sharpest declines.. Understanding this topic is essential for both UPSC Prelims and Mains preparation.
Why is What are the Key Highlights of the Multidimensional Poverty Index in India Since 2005-2006? important for UPSC exam?
What are the Key Highlights of the Multidimensional Poverty Index in India Since 2005-2006? is a Medium-level topic in UPSC Social Issues. It is tested in both Prelims (factual MCQs) and Mains (analytical answer writing). Previous year UPSC questions have frequently covered aspects of What are the Key Highlights of the Multidimensional Poverty Index in India Since 2005-2006?, making it essential for comprehensive IAS preparation.
How to prepare What are the Key Highlights of the Multidimensional Poverty Index in India Since 2005-2006? for UPSC?
To prepare What are the Key Highlights of the Multidimensional Poverty Index in India Since 2005-2006? for UPSC: (1) Study the comprehensive notes covering all key concepts on Vaidra. (2) Practice previous year questions on this topic. (3) Connect it with current affairs using daily updates. (4) Revise using key takeaways and mind maps available for Social Issues. (5) Write practice answers linking What are the Key Highlights of the Multidimensional Poverty Index in India Since 2005-2006? to related GS Paper topics.
Key takeaways of What are the Key Highlights of the Multidimensional Poverty Index in India Since 2005-2006? for UPSC
- India saw a significant 17.89% point reduction in multidimensional poverty from 2013-14 to 2022-23.
- Approximately 24.82 crore people escaped multidimensional poverty in the last nine years.
- Uttar Pradesh, Bihar, Madhya Pradesh, and Rajasthan recorded the sharpest declines.
- All 12 MPI indicators, across Health, Education, and Standard of Living, showed improvement.
- Severity of Deprivation (SoD) declined, though at a slightly slower rate in recent years.
What are the Key Highlights of the Multidimensional Poverty Index in India Since 2005-2006?
Medium⏱️ 8 min read
social issues
📖 Introduction
Overview of Multidimensional Poverty Reduction in India
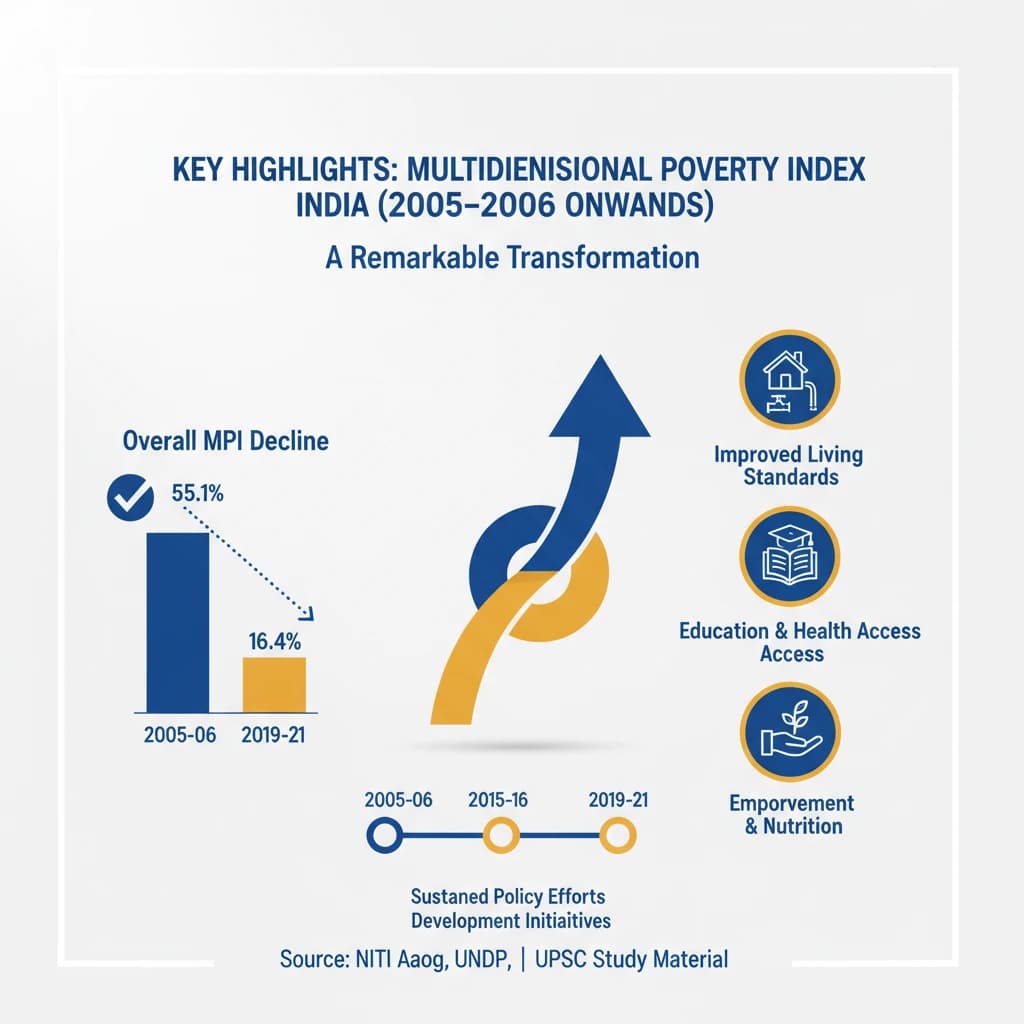
India has achieved a remarkable reduction in multidimensional poverty since 2005-2006, demonstrating significant progress across various indicators. This decline highlights the effectiveness of sustained policy efforts and developmental initiatives.
Overall Decline in Multidimensional Poverty
The nation has witnessed a substantial decrease in its Multidimensional Poverty Index (MPI). This reduction signifies a positive shift in the living standards and well-being of a large segment of the population.
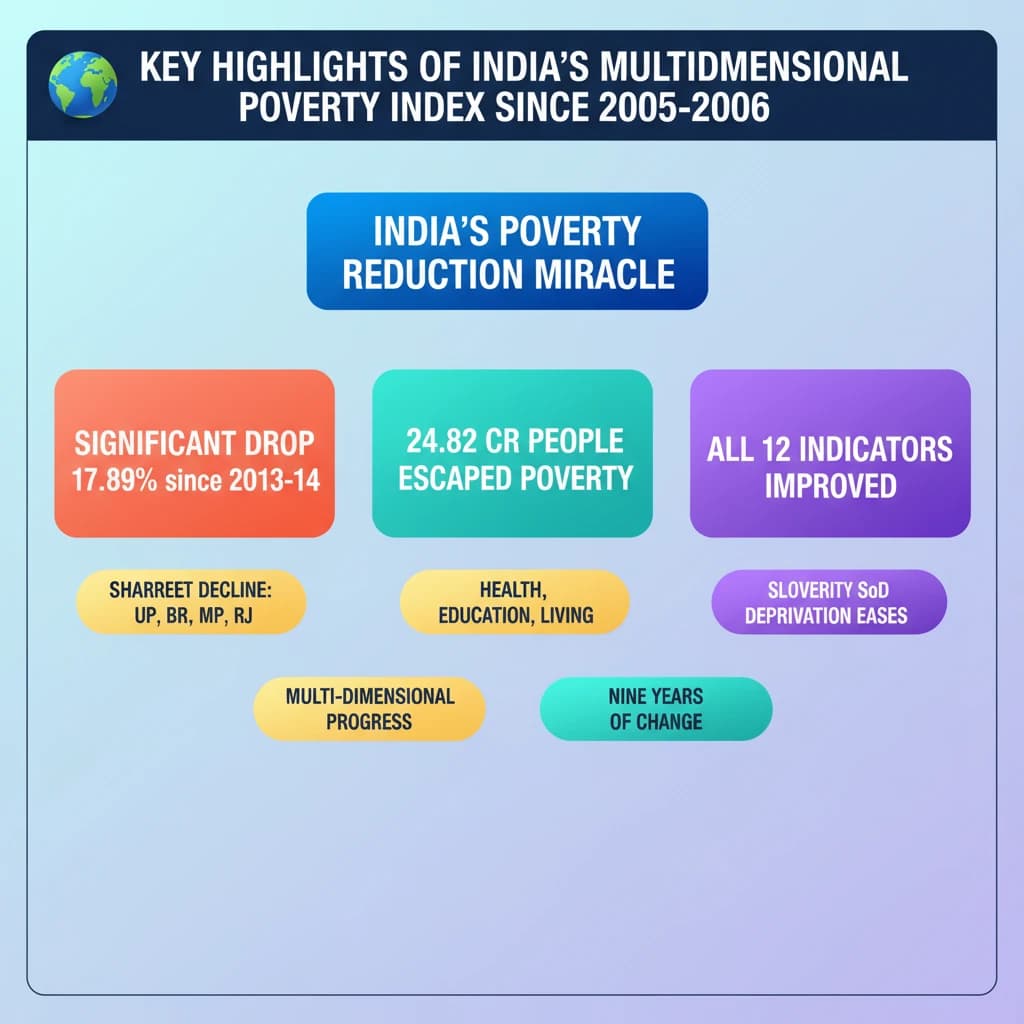
- MPI Reduction (2013-14 to 2022-23): From 29.17% to 11.28%.
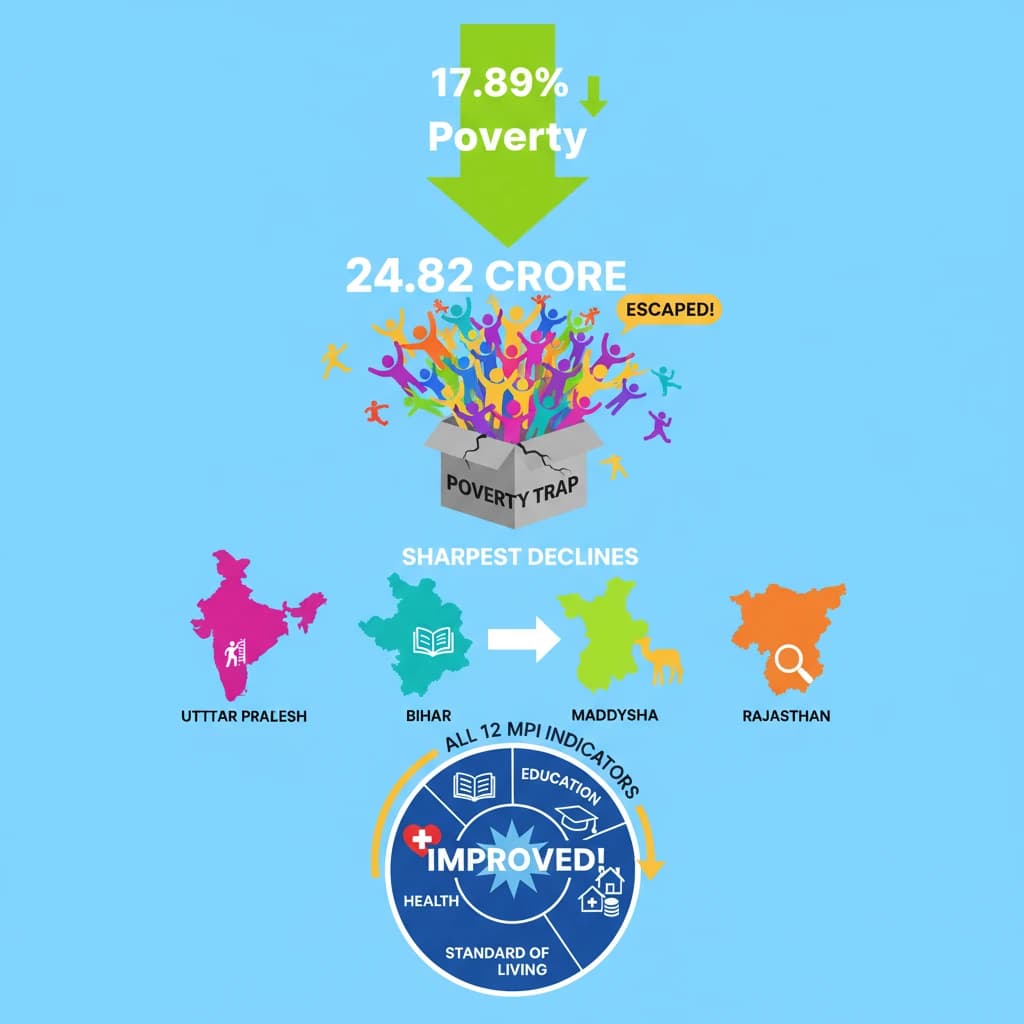
- Total Decrease: A significant 17.89% points.
- People Escaping Poverty: Approximately 24.82 crore people have moved out of multidimensional poverty in the last nine years (2013-14 to 2022-23).
This positive trajectory is largely attributed to various government initiatives aimed at improving social and economic indicators across the country.
State-wise Performance in Poverty Reduction
Several states have played a pivotal role in driving this national reduction, showcasing concentrated efforts and impactful policy implementation at the regional level.
The states recording the sharpest decline in the number of people classified as poor based on the MPI are: Uttar Pradesh, Bihar, Madhya Pradesh, and Rajasthan.
- Uttar Pradesh: Recorded the largest decline, with 5.94 crore people escaping multidimensional poverty.
- Bihar: Followed with 3.77 crore people moving out of poverty.
- Madhya Pradesh and Rajasthan: Also showed substantial improvements.
Improvement Across All MPI Indicators
The progress is not confined to a few areas but is broad-based, indicating holistic development. This comprehensive improvement reflects a concerted effort to address various facets of deprivation.
All 12 indicators of the Multidimensional Poverty Index have shown significant improvement. These indicators span the critical dimensions of Health, Education, and Standard of Living.
Understanding the 12 indicators and their improvement is crucial for Mains answers, especially in GS Paper I (Society) and GS Paper II (Social Justice). Mentioning specific dimensions like Health, Education, and Standard of Living adds depth to your analysis.
Trends in Severity of Deprivation (SoD)
The Severity of Deprivation (SoD) provides insights into the intensity of poverty, measuring the average deprivations suffered by multidimensionally poor individuals.
The Severity of Deprivation (SoD) declined at a slightly lower rate between 2015-16 and 2019-21 compared to the earlier period of 2005-06 and 2013-14.
This trend suggests that while overall poverty is reducing, tackling the deepest forms of deprivation might require more targeted and intensified interventions in the recent period.
💡 Key Takeaways
- •India saw a significant 17.89% point reduction in multidimensional poverty from 2013-14 to 2022-23.
- •Approximately 24.82 crore people escaped multidimensional poverty in the last nine years.
- •Uttar Pradesh, Bihar, Madhya Pradesh, and Rajasthan recorded the sharpest declines.
- •All 12 MPI indicators, across Health, Education, and Standard of Living, showed improvement.
- •Severity of Deprivation (SoD) declined, though at a slightly slower rate in recent years.
🧠 Memory Techniques
95% Verified Content