Loading page, please wait…
Vaidra Logo
Vaidra

Top 4 items + smart groups

UPSC GPT
New
Current Affairs
Daily Solutions
Daily Puzzle
Mains Evaluator

Version 2.0.0 • Built with ❤️ for UPSC aspirants

Loading...
Loading...
Loading...
Loading...
Loading...
Loading...
Loading...
Loading...
Loading...
Loading...
Loading...
Loading...
Loading...
Back
All Subjects

Topics

0 topics • 0 completed

Loading topics...
Loading...
Loading...
Loading...
Loading...
Loading...
Overall Progress0%
What are the Key Highlights of the World Solar Report Series? - UPSC Environment And Ecology

What are the Key Highlights of the World Solar Report Series? - UPSC Environment And Ecology

What is What are the Key Highlights of the World Solar Report Series? in UPSC Environment And Ecology?

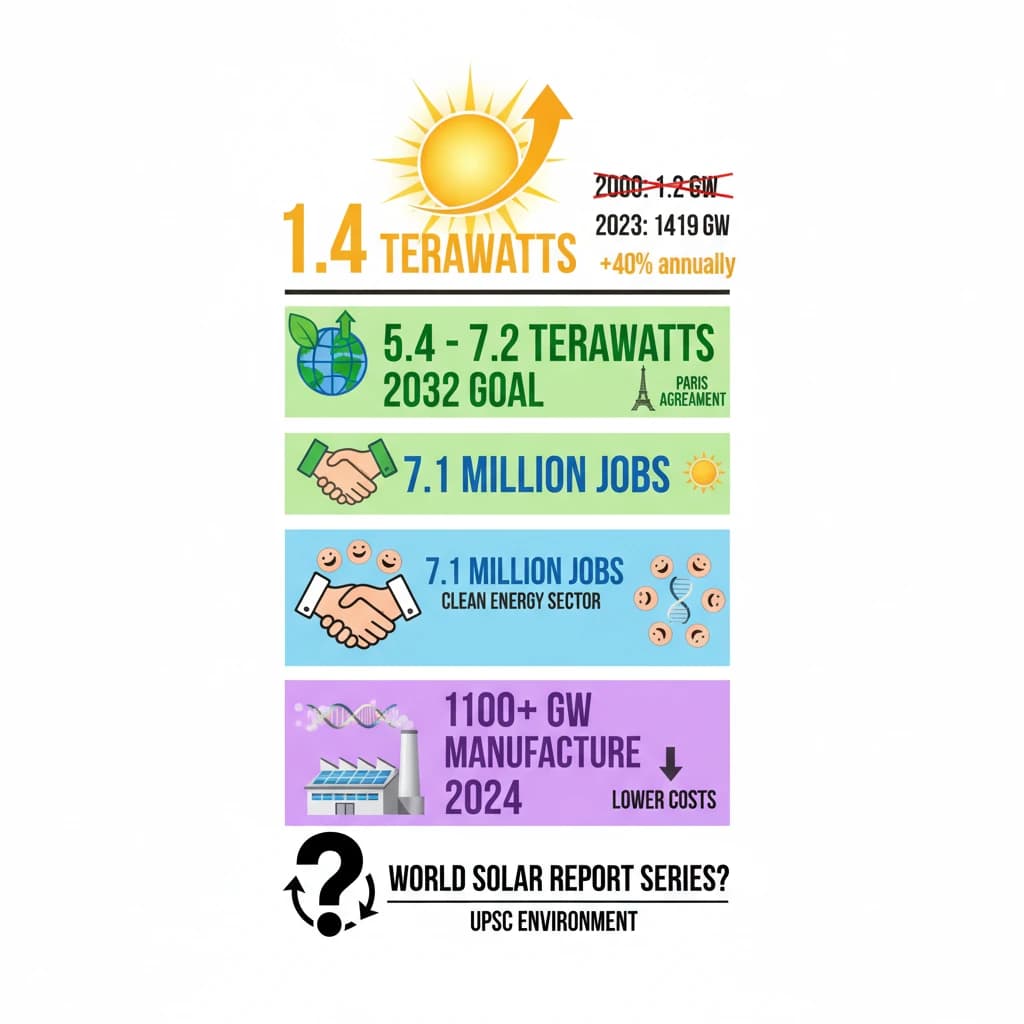
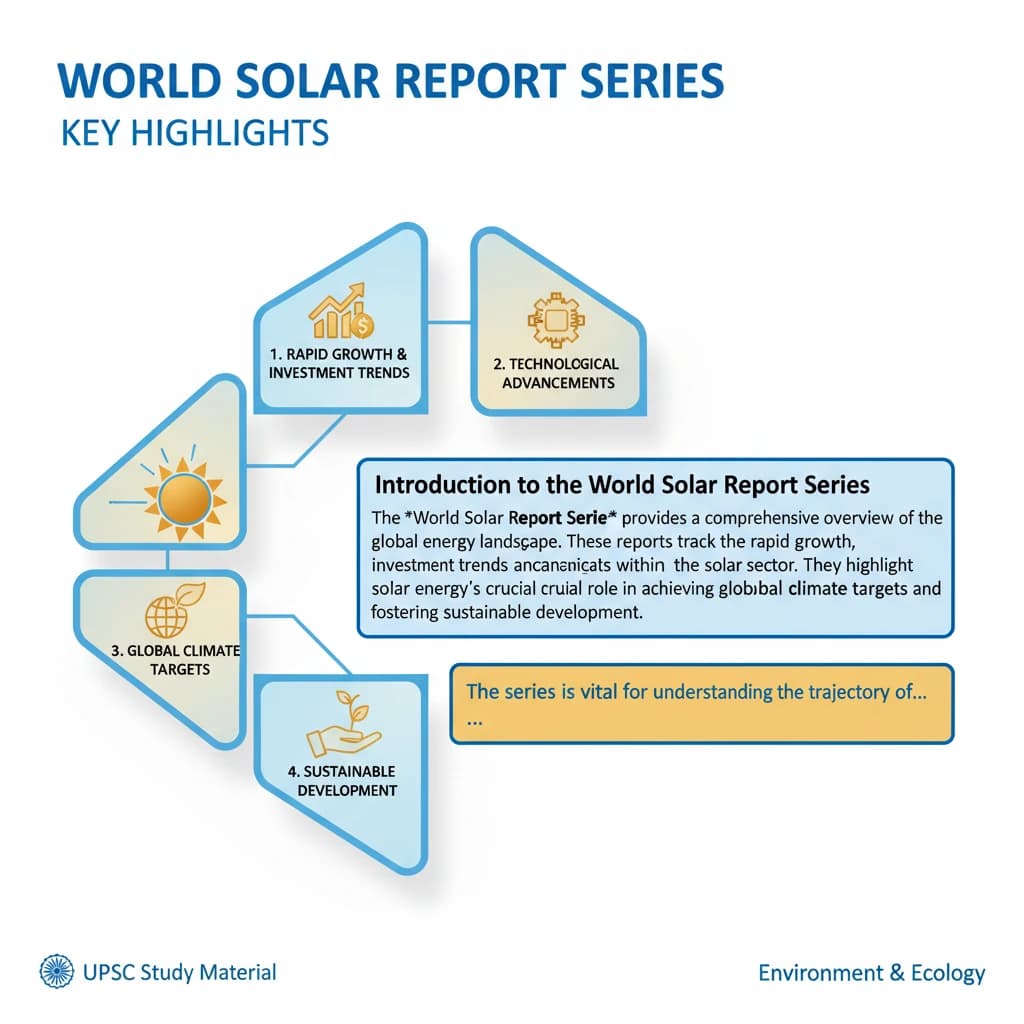
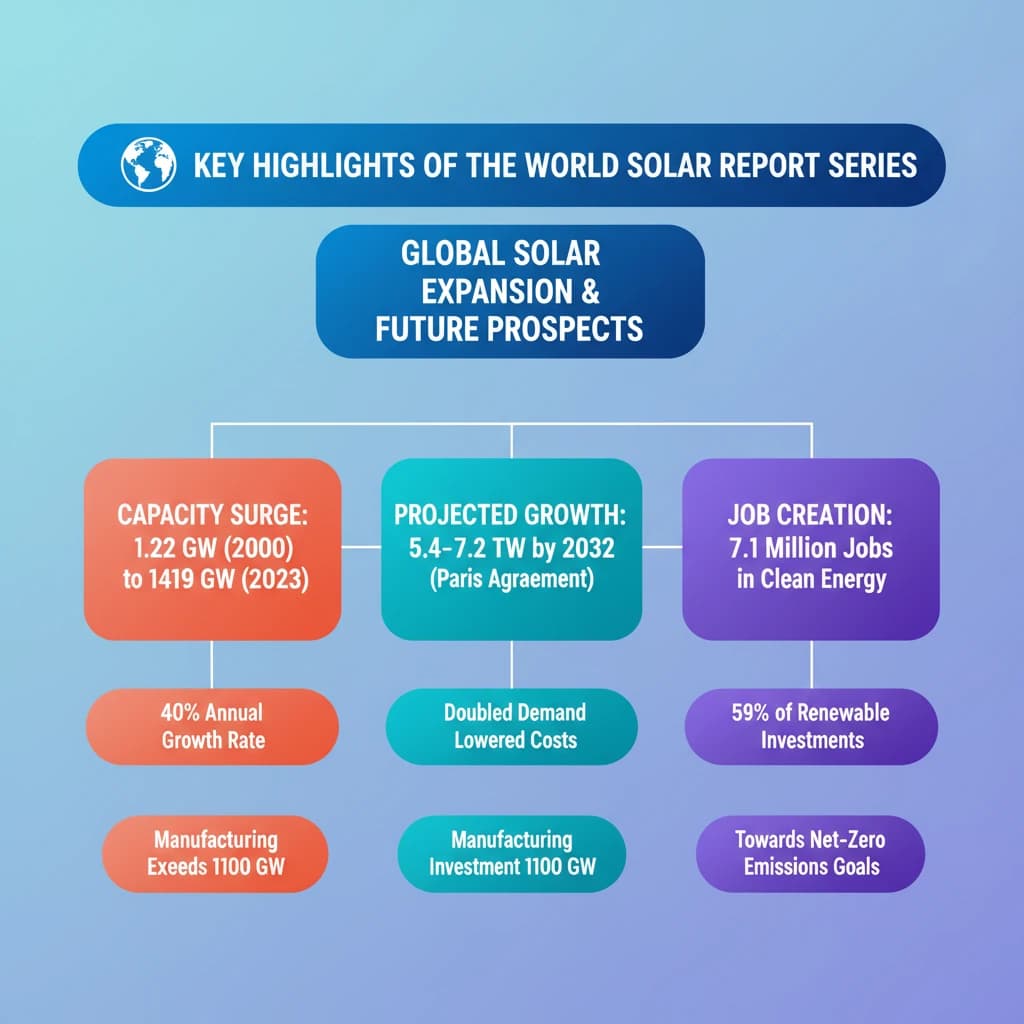
What are the Key Highlights of the World Solar Report Series? is a key topic under Environment And Ecology for UPSC Civil Services Examination. Key points include: Global solar capacity grew from 1.22 GW (2000) to 1,418.97 GW (2023), with a 40% annual rate.. Solar capacity is projected to reach 5,457.7 - 7,203.9 GW by 2032, driven by Paris Agreement goals.. Solar energy accounts for 7.1 million jobs in the clean energy sector.. Understanding this topic is essential for both UPSC Prelims and Mains preparation.

Why is What are the Key Highlights of the World Solar Report Series? important for UPSC exam?

What are the Key Highlights of the World Solar Report Series? is a Medium-level topic in UPSC Environment And Ecology. It is tested in both Prelims (factual MCQs) and Mains (analytical answer writing). Previous year UPSC questions have frequently covered aspects of What are the Key Highlights of the World Solar Report Series?, making it essential for comprehensive IAS preparation.

How to prepare What are the Key Highlights of the World Solar Report Series? for UPSC?

To prepare What are the Key Highlights of the World Solar Report Series? for UPSC: (1) Study the comprehensive notes covering all key concepts on Vaidra. (2) Practice previous year questions on this topic. (3) Connect it with current affairs using daily updates. (4) Revise using key takeaways and mind maps available for Environment And Ecology. (5) Write practice answers linking What are the Key Highlights of the World Solar Report Series? to related GS Paper topics.

Key takeaways of What are the Key Highlights of the World Solar Report Series? for UPSC

  • Global solar capacity grew from 1.22 GW (2000) to 1,418.97 GW (2023), with a 40% annual rate.
  • Solar capacity is projected to reach 5,457.7 - 7,203.9 GW by 2032, driven by Paris Agreement goals.
  • Solar energy accounts for 7.1 million jobs in the clean energy sector.
  • Global solar manufacturing will exceed 1,100 GW by 2024, doubling demand and lowering costs.
  • Clean energy investments nearly double fossil fuel investments, with solar attracting 59% of renewable investments.
  • Asia-Pacific leads in solar investments, followed by Europe, Middle East, and Africa.
  • Monocrystalline solar PV modules have achieved 24.9% efficiency.
What are the Key Highlights of the World Solar Report Series?

What are the Key Highlights of the World Solar Report Series?

Medium⏱️ 8 min read✓ 95% Verified
environment and ecology

📖 Introduction

<h4>Introduction to the World Solar Report Series</h4><p>The <strong>World Solar Report Series</strong> provides a comprehensive overview of the global solar energy landscape. These reports track the rapid growth, investment trends, and technological advancements within the solar sector. They highlight solar energy's crucial role in achieving global climate targets and fostering sustainable development.</p><div class='key-point-box'><p>The series is vital for understanding the trajectory of <strong>renewable energy transition</strong> and its implications for the global economy and environment.</p></div><h4>Key Highlights from the World Solar Market Report</h4><p>The <strong>World Solar Market Report</strong> reveals an extraordinary expansion in global solar capacity. This growth underscores the increasing adoption and economic viability of solar power worldwide.</p><div class='info-box'><p><strong>Global Solar Capacity Growth:</strong></p><ul><li><strong>2000:</strong> Just <strong>1.22 GW</strong></li><li><strong>2023:</strong> Reached an impressive <strong>1,418.97 GW</strong></li><li>Reflects a remarkable <strong>40% annual growth rate</strong> over this period.</li></ul></div><p>Future projections indicate continued exponential growth, driven by international climate commitments. The demand for clean energy infrastructure is rapidly escalating.</p><div class='info-box'><p><strong>Projected Global Solar Capacity:</strong></p><ul><li>By <strong>2032:</strong> Expected to reach <strong>5,457.7 - 7,203.9 GW</strong>.</li><li>This surge is directly linked to the ambitious goals of the <strong>Paris Agreement</strong>, necessitating a massive infrastructure push.</li></ul></div><p>The clean energy sector, particularly solar, has become a significant source of employment globally. This growth contributes to economic development and job creation.</p><div class='info-box'><p><strong>Employment in Clean Energy:</strong></p><ul><li>Overall clean energy industry supports <strong>16.2 million jobs</strong>.</li><li><strong>Solar energy</strong> alone accounts for a substantial <strong>7.1 million jobs</strong> within this sector.</li></ul></div><p>Global manufacturing capabilities for solar components are also expanding rapidly. This increase in supply is making solar technology more accessible and affordable worldwide.</p><div class='info-box'><p><strong>Solar Manufacturing Capacity:</strong></p><ul><li>Set to exceed <strong>1,100 GW by 2024</strong>.</li><li>This capacity is projected to be <strong>double the global demand</strong>, contributing to lower costs and wider adoption of solar solutions.</li></ul></div><h4>Insights from the World Investment Report</h4><p>The <strong>World Investment Report</strong> highlights a significant shift in global energy investments towards clean energy sources. This trend indicates a growing confidence in renewables over fossil fuels.</p><div class='info-box'><p><strong>Global Energy Investments:</strong></p><ul><li><strong>2018:</strong> Total investments stood at <strong>USD 2.4 trillion</strong>.</li><li><strong>2024 (Projected):</strong> Expected to rise to <strong>USD 3.1 trillion</strong>.</li><li>Crucially, <strong>clean energy investments</strong> are nearly <strong>doubling those in fossil fuels</strong>.</li></ul></div><p>Within the renewable energy sector, solar power attracts the largest share of investments. This dominance is largely attributed to the decreasing cost of solar panels.</p><div class='info-box'><p><strong>Solar's Share in Renewable Investments:</strong></p><ul><li><strong>59%</strong> of total renewable energy investments are directed towards solar.</li><li>This high percentage is primarily driven by the consistently <strong>lower panel costs</strong>, making solar an attractive investment.</li></ul></div><p>Geographically, certain regions are leading the charge in solar investments. Their proactive policies and growing energy demands contribute to their prominent positions.</p><div class='info-box'><p><strong>Leading Regions in Solar Investments:</strong></p><ul><li><strong>Asia-Pacific (APAC)</strong> leads the world in solar investments.</li><li>Followed by <strong>Europe, the Middle East and Africa (EMEA)</strong>, demonstrating broad global engagement.</li></ul></div><h4>Findings from the World Technology Report</h4><p>The <strong>World Technology Report</strong> focuses on advancements in solar photovoltaic (PV) module efficiency. Improved technology is key to maximizing energy output from solar installations.</p><div class='info-box'><p><strong>Monocrystalline Solar PV Modules:</strong></p><ul><li>These advanced solar panels have achieved an impressive efficiency of <strong>24.9%</strong>.</li><li>This high efficiency means more electricity can be generated from a smaller area, making solar more viable for various applications.</li></ul></div><div class='exam-tip-box'><p>For UPSC, remember these reports provide data points to support arguments on <strong>renewable energy policy</strong>, <strong>climate change mitigation</strong>, and <strong>economic development</strong> in Mains <strong>GS-III</strong> and <strong>Essay</strong> papers. Quote specific figures to add weight to your answers.</p></div>
Concept Diagram

💡 Key Takeaways

  • •Global solar capacity grew from 1.22 GW (2000) to 1,418.97 GW (2023), with a 40% annual rate.
  • •Solar capacity is projected to reach 5,457.7 - 7,203.9 GW by 2032, driven by Paris Agreement goals.
  • •Solar energy accounts for 7.1 million jobs in the clean energy sector.
  • •Global solar manufacturing will exceed 1,100 GW by 2024, doubling demand and lowering costs.
  • •Clean energy investments nearly double fossil fuel investments, with solar attracting 59% of renewable investments.
  • •Asia-Pacific leads in solar investments, followed by Europe, Middle East, and Africa.
  • •Monocrystalline solar PV modules have achieved 24.9% efficiency.

🧠 Memory Techniques

Memory Aid
95% Verified Content

Related Topics

Loading related topics...
Explore:Environment And Ecology Topics·All Subjects·Daily Current Affairs·Editorial Analysis·Previous Year Questions·UPSC GPT